Selection of Target Indices
Initial candidates included FTSE-100, FTSE China A-50, SSE-50, NASDAQ 100, HSI, MSCI A-50, MSCIWI, DJIA, and S&P 500.
We finally decided to use FTSE-100, FTSE China A-50, SP 500, and NASDAQ 100 as target indices according to data availability, target regions, popularity, rebalancing frequency, and entry/exit mechanisms.

Data Collection
The UK market data was collected from Bloomberg.
The Chinese market data was collected from Wind.
The US market data was collected from multiple online sources.
Historical rebalancing information was collected from official websites and supplemented by Internet Archive and index ETF websites.
Data Processing
Several steps, including data cleaning, data formatting, data integration, and feature selection were conducted.
Anticipatory Effect Validation
We identified the investment opportunities caused by index rebalancing in FTSE-100 and FTSE China A-50: stocks to be added have an increasing return trend, and stocks to be deleted have a decreasing return trend. After the announcement, the abnormal return rate change will be gone. The phenomenon is known as anticipatory effects.

Model Selection and Training
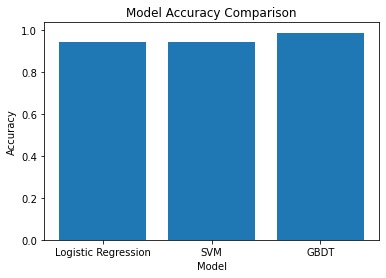
Three models were selected and trained on collected data: Logistic Regression, SVM, and GBDT. The model performance on FTSE China A50 is as follows:


Problem Ecountered in US Indices
The anticipatory effect was not significant in the addition of index rebalancing. The Models also had difficulties learning due to insufficient data.


More Insight into Index Rebalancing
The US market results made us recognize that simply predicting the rebalancing may not yield profit, so we explored the potential features behind the index rebalancing idea.
To solve the data insufficiency problem, we made use of an online trading simulation platform called WorldQuant Brain, which has rich data fields, built-in functions, and back-testing APIs for quantitative trading. Users can simply validate their trading ideas by building alpha expressions.
We started with the fact that index rebalancing largely relies on market capital and tested a few alpha expressions derived from market capital and one of them demonstrated positive performance.

Strategy Imprivement Using GAs
We were happy about our findings, but the performance was not robust. We then adopted Genetic Algorithms, another simple machine learning model, to combine the expression with other financial factors.
After three to four generations, the model outputted several outstanding mixed alpha expressions. We further analyzed the expressions and constructed a final expression that achieved a Sharpe ratio of 3.53, a Fitness of 1.58, and a Drawdown of 3.86.
